








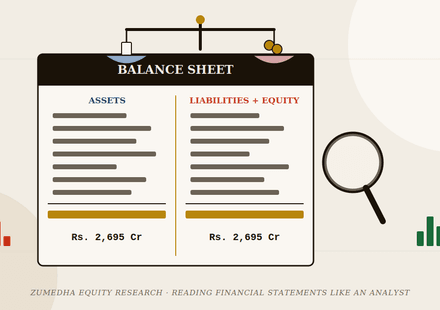
How to Read a Balance Sheet and Cash Flow Statement Like an Analyst
Overview Balance Sheet Analyst Lens Cash Flow Reading CFS Cross-Checks Red Flags Checklist Worked Example Caveats FAQ Most retail investors read a balance sheet and a cash flow statement the way they...
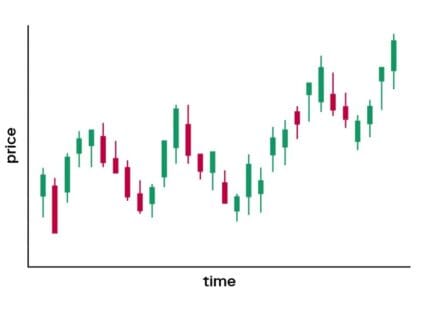
Stock Price Chart Patterns, Explained and Illustrated- 38 Chart Patterns
Stock Chart Patterns & Technical Analysis: The Complete Visual Guide | Zumedha Equity Research Skip to content Technical Analysis Reference Guide 40 Charts A complete, colour-coded reference to...
What is DCF (Discounted Cash Flow)? Why is it used?
DCF (Discounted Cash Flow) is one of the most important valuation methods in finance used to estimate the intrinsic value of an asset (like a stock, company, or project). 🔹 What is DCF? DCF is based...
Buy vs Accumulate Rating in Stocks: Key Differences Every Investor Must Know
If you have ever read an equity research report and wondered what the difference between a Buy and an Accumulate rating really is — you are not alone. These two terms are often confused, yet they...
What is RSI (Relative Strength Index)?
RSI is a momentum indicator that measures the speed and magnitude of a stock’s recent price changes. It was developed by J. Welles Wilder and is one of the most widely used technical analysis...