






How to Read a Balance Sheet and Cash Flow Statement Like an Analyst
Most retail investors read a balance sheet and a cash flow statement the way they read a restaurant menu — scanning for one or two familiar words and skipping the rest. Analysts read them the way a detective reads a crime scene: every line is a clue, and the story is rarely the one the profit and loss statement tells on its own. This guide walks through balance sheet analysis and cash flow statement analysis the way it’s actually done inside equity research desks, stock analysis, and target-price work — with worked examples, ratios, red flags, and a step-by-step checklist you can apply to any listed company’s annual report or quarterly filing.
Why the Balance Sheet and Cash Flow Statement Matter More Than the P&L
Every company publishes three core financial statements: the Profit & Loss (income) statement, the Balance Sheet, and the Cash Flow Statement. Most first-time investors stop at the P&L because “profit” is the easiest number to understand. But profit is an opinion — it depends on judgment calls about depreciation schedules, provisioning, revenue recognition, and inventory valuation. Cash is a fact. That’s precisely why analysts triangulate all three statements before forming a view, and why a company can show rising profit for years while quietly running out of cash.
Balance Sheet Anatomy: Assets, Liabilities, and Equity
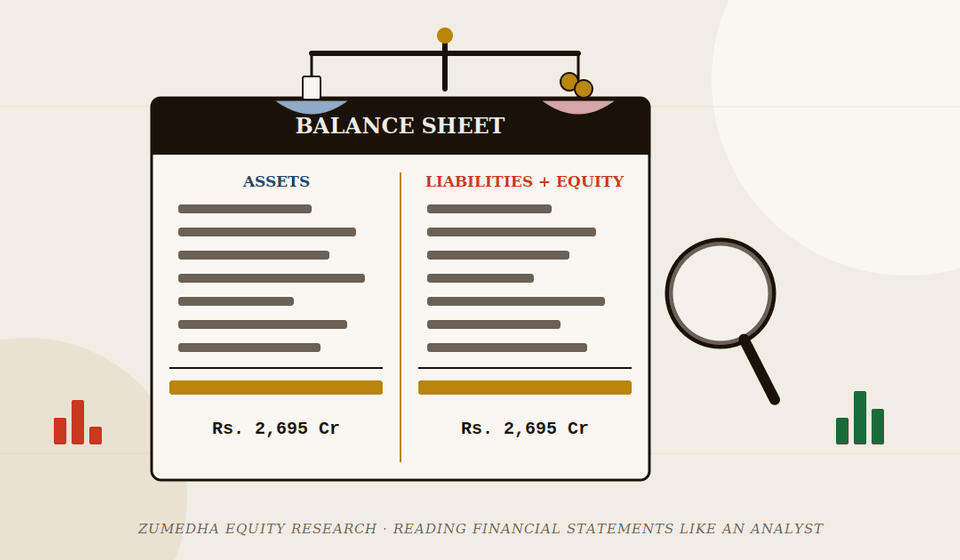
The balance sheet rests on one identity that must always hold true:
Assets — what the company owns
- Current assets (convert to cash within 12 months): cash & equivalents, receivables (money owed by customers), inventory, short-term investments.
- Non-current assets: property/plant/equipment (PP&E), intangible assets, goodwill, long-term investments, deferred tax assets.
Liabilities — what the company owes
- Current liabilities (due within 12 months): trade payables, short-term borrowings, current portion of long-term debt, accrued expenses.
- Non-current liabilities: long-term debt/bonds, deferred tax liabilities, long-term lease obligations, employee benefit provisions.
Shareholders’ Equity — the residual claim
Share capital, reserves & surplus (including retained earnings), and — in a consolidated statement — minority/non-controlling interest. This is what would theoretically be left for shareholders if every asset were sold and every liability paid off.
Illustrative Balance Sheet (₹ Crore)
| Line Item | FY24 | FY25 | FY26 |
|---|---|---|---|
| Cash & Equivalents | 210 | 180 | 95 |
| Trade Receivables | 340 | 410 | 560 |
| Inventory | 280 | 310 | 390 |
| Net PP&E | 1,150 | 1,220 | 1,340 |
| Goodwill & Intangibles | 90 | 90 | 310 |
| Total Assets | 2,070 | 2,210 | 2,695 |
| Trade Payables | 260 | 270 | 290 |
| Short-term Borrowings | 150 | 210 | 340 |
| Long-term Debt | 420 | 440 | 710 |
| Total Liabilities | 830 | 920 | 1,340 |
| Share Capital & Reserves | 1,240 | 1,290 | 1,355 |
Just from this table, a trained eye would already flag three things before opening the P&L — covered in the analyst-lens section below.
Reading a Balance Sheet Like an Analyst
1. Liquidity — can the company pay its near-term bills?
A current ratio comfortably above 1.0–1.5x is generally healthy for most industrial businesses, though the “right” number is sector-specific — retailers and FMCG companies routinely run tight or sub-1x current ratios profitably because of fast inventory turns and negative working capital models.
2. Leverage — how much of the balance sheet is borrowed?
In the illustrative table above, total debt rose from ₹570 Cr to ₹1,050 Cr in a single year while cash fell from ₹180 Cr to ₹95 Cr — net debt nearly tripled. That alone is a prompt to check the cash flow statement for what the borrowed money actually funded.
3. Asset quality — is what’s on the books really worth what it says?
- Goodwill and intangibles: these jumped from ₹90 Cr to ₹310 Cr in the example above — almost certainly from an acquisition. Goodwill isn’t a productive asset; it’s an accounting plug for the premium paid over fair value, and it can be impaired (written down) later, hitting reported profit.
- Receivables growing faster than revenue can mean the company is stuffing the channel or extending generous credit to book sales — worth cross-checking against revenue growth in the P&L.
- Inventory build-up ahead of demand can signal slowing sell-through or overproduction.
4. What sits below the balance sheet
Contingent liabilities, guarantees given on behalf of subsidiaries or promoters, and off-balance-sheet lease commitments live in the notes to accounts, not in the main balance sheet body. Analysts routinely read the notes before the numbers.
Cash Flow Statement Anatomy: Operating, Investing, Financing
The cash flow statement (CFS) is split into three buckets, and each answers a different question:
Cash Flow from Operations (CFO)
Cash generated by the core business — starts from net profit and adjusts for non-cash items (depreciation, provisions) and changes in working capital (receivables, payables, inventory).
Cash Flow from Investing (CFI)
Capex, acquisitions, purchase/sale of investments. Usually negative for a growing company — that’s expected, not automatically bad.
Illustrative Cash Flow Statement (₹ Crore, FY26)
| Line Item | Amount |
|---|---|
| Net Profit | 185 |
| Add: Depreciation | 140 |
| Less: Increase in Receivables | (150) |
| Less: Increase in Inventory | (80) |
| Add: Increase in Payables | 20 |
| Cash Flow from Operations (CFO) | 115 |
| Capex (Purchase of PP&E) | (260) |
| Acquisition (net of cash acquired) | (220) |
| Cash Flow from Investing (CFI) | (480) |
| Proceeds from Borrowings | 480 |
| Dividends Paid | (60) |
| Cash Flow from Financing (CFF) | 420 |
| Net Change in Cash | 55 |
Reading a Cash Flow Statement Like an Analyst
1. CFO vs Net Profit — the single most important cross-check
In the example, net profit is ₹185 Cr but CFO is only ₹115 Cr — the gap is almost entirely working-capital growth (receivables and inventory rising faster than payables). One year of this can be normal in a growth phase; two or three consecutive years of CFO persistently and meaningfully below net profit is a classic quality-of-earnings warning sign.
2. Free Cash Flow (FCF) — cash left after keeping the lights on
In the example: ₹115 Cr − ₹260 Cr = −₹145 Cr (negative FCF, funded here mostly by fresh borrowing).
FCF is what’s actually available to pay down debt, pay dividends, buy back shares, or reinvest without external funding. A company can look profitable and still be FCF-negative for years if capex or working capital keeps consuming cash faster than operations generate it.
3. Capex intensity and what it’s funding
Compare capex to depreciation. Capex meaningfully above depreciation for several years usually signals a genuine growth/expansion phase (fine, if returns eventually show up in revenue and margins) or a capital-intensive maintenance treadmill (less fine, if revenue isn’t growing to match).
4. Reading the financing section as a signal, not just a number
- Repeated equity issuance to fund operating losses is a dilution red flag.
- Large debt raises alongside negative FCF (as in the example) means growth or acquisitions are debt-funded — check whether interest coverage can absorb it.
- Buybacks funded by fresh borrowing rather than free cash flow deserve scrutiny — it’s financial engineering, not organic capital return.
- Consistent, growing dividends paid entirely from CFO (not from borrowings) are a positive quality signal.
Cross-Checking All Three Statements Together
The three statements are meant to reconcile, and checking that they do is a core analyst habit:
- Net profit (P&L) flows into the starting line of the Cash Flow Statement, and into Retained Earnings on the Balance Sheet (adjusted for dividends paid).
- The Cash Flow Statement’s “Net Change in Cash” should exactly explain the year-on-year change in the Cash & Equivalents line on the Balance Sheet.
- Capex on the Cash Flow Statement should roughly explain the increase in gross PP&E on the Balance Sheet (before depreciation).
- New borrowings/repayments on the Cash Flow Statement should reconcile with the change in the debt lines on the Balance Sheet.
When these don’t tie out cleanly (after accounting for known items like forex translation or a specific acquisition), it’s worth digging into the notes — sometimes it’s a disclosure nuance, occasionally it’s a sign the numbers deserve more scrutiny.
Common Red Flags and Pitfalls
Signals of Quality
- CFO consistently exceeds or tracks net profit
- Receivables/inventory growth in line with revenue growth
- Debt growth matched by proportionate EBITDA growth
- Dividends and buybacks funded by free cash flow
- Stable or improving working capital cycle (days)
Warning Signs
- Net profit rising while CFO stagnates or falls
- Receivables/inventory growing faster than sales, quarter after quarter
- Large “other income” or one-off gains propping up the bottom line
- Frequent related-party transactions or loans to promoter entities
- Ballooning goodwill from serial acquisitions with little integration disclosure
- Capitalizing costs that competitors expense (inflates both assets and profit)
- Contingent liabilities or guarantees that dwarf net worth
- Auditor qualifications, resignations, or frequent auditor changes
A Practical Step-by-Step Checklist
- Read the auditor’s report and notes to accounts first — qualifications, going-concern remarks, or related-party disclosures set the context for everything else.
- Pull 3–5 years of Balance Sheet and Cash Flow Statement side by side, not just the latest year.
- Compute current ratio, debt-to-equity, and net debt trend.
- Compare CFO to net profit for each of the last 3–5 years — flag any persistent, widening gap.
- Calculate free cash flow (CFO minus capex) for each year.
- Check receivable days, inventory days, and payable days versus revenue growth.
- Identify what’s driving any change in goodwill/intangibles — organic or acquired?
- Read the financing section: is debt/equity raised funding growth, or plugging an operating cash shortfall?
- Scan for related-party transactions and contingent liabilities in the notes.
- Benchmark every ratio against 2–3 direct sector peers, not against a generic textbook threshold.
Putting It Together: What the Illustrative Numbers Actually Say
Stepping back and reading the illustrative company’s FY24–FY26 numbers as a research analyst would:
Analyst Read-Through
Revenue-generating assets (receivables, inventory, PP&E) all grew, but so did leverage — net debt roughly tripled over two years while cash on hand fell. Cash flow from operations lagged well behind net profit, driven by working capital consuming cash faster than the business generated it, and free cash flow turned meaningfully negative once capex and an acquisition are included. The acquisition itself added ₹220 Cr of goodwill to the balance sheet with no cash-generating detail visible from the numbers alone. None of this makes the company a “sell” by itself — but it means the growth story is currently debt-funded rather than self-funded, and the next 2–3 quarters of CFO and receivable-days trends would need to improve materially before this qualifies as a quality compounder rather than a leveraged growth bet.
Caveats and Sector-Specific Nuances
- Banks and NBFCs don’t have a conventional “cash flow from operations” that’s comparable to industrial companies — loans given out are their inventory, and deposits/borrowings are their raw material. Use sector-specific metrics instead: Net Interest Margin, Gross/Net NPA, Provision Coverage Ratio, Capital Adequacy Ratio.
- Capital-intensive sectors (power, telecom, infrastructure) run structurally high debt-to-equity as a matter of business model, not distress — compare only against direct peers.
- Companies reporting under Ind AS in India now capitalize most leases on the balance sheet (Ind AS 116), which mechanically inflates both assets and liabilities versus older filings — check the lease note before comparing across years or against pre-Ind AS 116 peers.
- Free tools like screener.in, the BSE/NSE filing pages, and the company’s own investor-relations page are reliable starting points for pulling multi-year statements quickly; always verify the base data against the actual annual report/exchange filing before relying on it for an investment decision.
- This framework is educational and analytical in nature, not a substitute for professional financial or investment advice.
Frequently Asked Questions
What is the single most important thing to check on a balance sheet?
The trend in net debt and working capital (receivables plus inventory, minus payables) relative to revenue growth. A widening gap between how fast a company is growing and how fast its debt or working capital is growing is usually the fastest way to spot trouble early.
Why can a company be profitable but still run out of cash?
Profit is an accounting measure that includes non-cash items and can be inflated by uncollected receivables or capitalized costs. If customers aren’t actually paying on time, or if cash is tied up in inventory or capex, a company can report rising profit while its bank balance shrinks.
What is a good current ratio?
There’s no universal number — 1.5x to 2x is a commonly cited comfort zone for industrial companies, but fast-turnover retail and FMCG businesses often operate healthily below 1x. Always benchmark against direct sector peers rather than a fixed rule of thumb.
How is free cash flow different from net profit?
Free cash flow (CFO minus capex) measures actual cash generated after funding the assets needed to run the business, while net profit includes non-cash accounting entries like depreciation and provisions. FCF is generally considered a harder number to manipulate than reported profit.
Where can I find a company’s balance sheet and cash flow statement in India?
The company’s annual report (posted on its investor-relations page and on BSE/NSE filings) is the primary source. Aggregator sites such as screener.in compile multi-year data conveniently, but figures should be cross-checked against the original exchange filing before use in any investment decision.
