






Transformers & Rectifiers (India) Ltd DCF Valuation & Share Price Analysis Aug 2026
Transformers & Rectifiers (India) Ltd
Business Overview
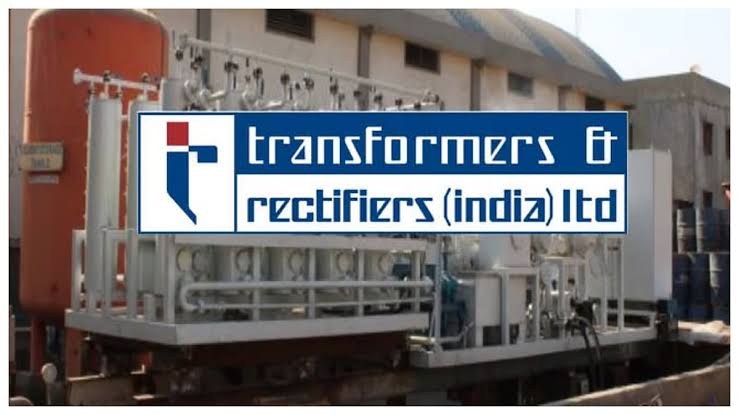
Transformers & Rectifiers (India) Ltd (TARIL), headquartered in Ahmedabad and originally incorporated in 1994 as Triveni Electric Company, is one of India’s established manufacturers of Power, Furnace and Rectifier Transformers. The product portfolio spans single-phase power transformers up to 500 MVA and 1200kV class, series and shunt reactors, mobile substations, earthing transformers and specialty converter-duty units, sold on a B2B model to power generation, transmission, distribution and industrial customers including NTPC, PGCIL, GETCO and state electricity boards.
The company operates four wholly-owned subsidiaries and a switchgear joint venture (T&R Switchgear Pvt Ltd), and has leaned into export markets and reverse/backward integration over FY25–FY26 to widen margins. Production volume rose to 33,000 MVA in FY26 from 29,118 MVA in FY25, and the company completed a ₹500 crore QIP in FY25 to fund capacity expansion and deleveraging.
Historical Financials
Consolidated revenue has scaled from ₹1,158 Cr (FY22) to ₹2,509 Cr (FY26), a period marked by sharp operating leverage — EBITDA margin expanded from 6% to ~15–16% as the order mix shifted toward higher-voltage EHV transformers and export contracts. Profit growth has been exceptional on a 5-year view but has flattened on a trailing-twelve-month basis, with quarterly earnings turning volatile through FY26.
| Rs Cr | FY22 | FY23 | FY24 | FY25 | FY26 | TTM |
|---|---|---|---|---|---|---|
| Sales | 1,158 | 1,396 | 1,291 | 2,017 | 2,509 | 2,552 |
| EBITDA | 74 | 121 | 134 | 327 | 383 | 388 |
| OPM % | 6% | 9% | 10% | 16% | 15% | 15% |
| Net Profit | 14 | 42 | 47 | 216 | 272 | 269 |
| EPS (₹) | 0.53 | 1.54 | 1.56 | 7.14 | 8.81 | 8.61 |
DCF Valuation
A 10-year FCFF DCF is built on revenue growth tapering from 20% to 7%, EBITDA margin expanding from 16% to a steady-state 18% by Year 5, a 25% tax rate, capex at 4% of sales, and incremental working capital at 12% of incremental revenue — reflecting TARIL’s currently elevated cash-conversion cycle (199 days in FY26). WACC of 12% and terminal growth of 5% are applied per house methodology.
| Rs Cr | Y1 | Y2 | Y3 | Y5 | Y7 | Y10 |
|---|---|---|---|---|---|---|
| Revenue | 3,062 | 3,674 | 4,335 | 5,733 | 7,191 | 9,141 |
| EBITDA | 490 | 606 | 737 | 1,032 | 1,294 | 1,645 |
| FCFF | 196 | 248 | 317 | 477 | 618 | 830 |
Sensitivity range across WACC 10–14% and terminal growth 4–6%: ₹153 – ₹307.
Relative Valuation & Peer Multiples
Against listed transformer peers, TARIL trades broadly in line with — to a modest premium over — the sector median on P/E, and at a premium on P/B given its thinner capital base and recent equity dilution. The peer set is capital-goods heavy and richly valued as a group, reflecting the multi-year India power transmission capex cycle.
| Company | Mkt Cap (Cr) | P/E (x) | P/B (x) | ROE % |
|---|---|---|---|---|
| TARIL | 8,742 | 33.8 | 5.8 | 19.1 |
| Voltamp Transformers | ~9,500 | ~31 | ~5.3 | ~17.0 |
| Bharat Bijlee | ~3,400 | ~23 | — | — |
| Indo Tech Transformers | ~1,770 | ~23 | — | — |
Peer figures are approximate, sourced from recent secondary market data (Jul–Aug 2026); verify against live terminal data before publishing.
Asset-Based Valuation / NAV
TARIL is not an asset-heavy business relative to its earnings power — fixed assets of ₹250 Cr sit against a market cap of ₹8,742 Cr. Book value stands at ₹50.5/share (P/B 5.8x). An asset-based approach is therefore a weak anchor here; it serves only as a deep-value floor check, well below both the DCF and current market price.
Earnings Power Value (EPV)
Capitalizing normalized TTM NOPAT (~₹269 Cr) at the 12% WACC, with zero credit given for future growth, yields an EPV of roughly ₹75/share. This is the conservative floor if the current growth and margin trajectory were to stall entirely — useful as a downside anchor rather than a target, and it sits well below CMP, underlining how growth-dependent the current valuation is.
Sum-of-the-Parts (SOTP)
TARIL is effectively a single-segment manufacturing business; the T&R Switchgear JV and export subsidiaries are not separately disclosed at a scale material to overall valuation. SOTP therefore collapses to the core DCF-derived enterprise value, with no material standalone value attributable to the JV/subsidiary stack at this stage of disclosure.
| Segment | Basis | Value (₹ Cr) |
|---|---|---|
| Core Transformer & Reactor Business | DCF (FCFF) | 6,515 |
| T&R Switchgear JV & Subsidiaries | Not separately material | — |
| Total Enterprise Value | 6,515 |
Buy Range
Entry zones below are anchored to the DCF fair value band, requiring a margin of safety before fresh accumulation given the working-capital and earnings-volatility flags in the current numbers.
Buy Scenario
Sell Range
At CMP ₹291, the stock already sits above the base-case DCF fair value with limited margin of safety. The zones below mark where the premium to intrinsic value becomes progressively harder to justify.
Sell Scenario
Future Growth Drivers
India’s transmission and distribution capex cycle — driven by grid strengthening, renewable evacuation infrastructure and rural/industrial electrification — underpins multi-year demand for EHV transformers. TARIL’s FY26 production of 33,000 MVA (+13% YoY), its ₹500 Cr QIP-funded capacity expansion, growing export order mix, and reverse-integration investments to protect margins are the principal growth levers. Order wins from PGCIL, GETCO and state utilities remain the key near-term catalysts to track.
Risks & Catalysts
Bull Catalysts
- Sustained PGCIL/state utility order inflow and export mix expansion
- Margin expansion via backward/reverse integration
- Working capital normalization unlocking positive FCF
- Sector-wide re-rating on India’s grid capex cycle
Bear Risks
- Elevated and lengthening cash conversion cycle (199 days FY26)
- Negative operating and free cash flow in FY26 despite profit growth
- Quarterly earnings volatility — TTM profit growth near flat
- Declining promoter holding (-10.6% over 3 years) and FII flows sensitive to broader risk sentiment
- Valuation already pricing in near-flawless execution
Zumedha Verdict
TARIL has built a genuinely strong operating franchise on the back of India’s transmission capex upcycle — production volumes, order wins and margins have all moved meaningfully higher since FY23. But the quality of that growth has softened in the trailing twelve months: profit growth has flattened, the cash conversion cycle has stretched to 199 days, and FY26 free cash flow turned sharply negative even as reported profit grew. Our base-case DCF, built on a still-generous 18% steady-state EBITDA margin and continued double-digit revenue growth, arrives at a fair value of ₹208/share — meaningfully below the current market price of ₹291. The peer-relative multiple looks more defensible than the cash-flow-based value, suggesting the market is pricing TARIL more on sector narrative and order-book optics than on demonstrated free cash generation. We would not chase the stock at current levels; a pullback toward the ₹195–215 fair-value band, alongside clear evidence of working-capital normalization, would materially improve the risk-reward.